Is the Price of Bitcoin (BTC/USD) Declining? Analyzing Tariffs, Technical Indicators, and Mount Gox

- Trump's trade policy, concerns about the recession, and Mt. Gox transfers have all affected the volatility of the price of bitcoin
- The accumulation trend score for Glassnodes indicates changes in investor mood as well as heightened selling pressure
- Markets are being impacted by Mt. Gox transactions, but tariff worries are taking center stage
As President Donald Trump’s trade plans intensify and impact market sentiment generally, Bitcoin’s wild journey continues. The price of bitcoin has been hovering at $80,000 per handle, which has caused the larger cryptocurrency market to plummet, wiping over $1 trillion in value in only one month.
As the financial markets are being affected by a worldwide trade war, the excitement around President Trump and his pro-crypto policies has subsided. BlackRock CEO Larry Fink said that if individuals become more focused on supporting their own country, which is known as nationalism, it could lead to higher inflation. President Trump’s tariff ideas have so far thrown a shadow over markets. Though it would probably affect prices, this isn’t necessarily a terrible thing because some people would find it appealing.
Crypto markets are being impacted by the increased fears of a recession. Economists at Goldman Sachs have raised the likelihood of a recession in the upcoming year from 15% to 20%. Their primary concern was Trump’s economic policy. Economists at Yardeni Research also increased their estimate of the recession from 20% to 35%, attributing this to Trump’s swift executive orders, firings, and tariffs.
Heatmap of Cryptocurrencies, March 13, 2025
Was the Recent Selloff Caused by Mt. Gox?
Mt. Gox transferred 11,834 bitcoins this month, including 11,502 to an unidentified wallet, according to Look on Chain.
Questions have been raised by the latest $1.07 billion transfer in March and the intricate repayment process that would begin in July 2023 and terminate on October 31. Why now? The legal specifics of creditor repayments may have an impact on the timing.
Even years after going bankrupt in 2014, every move made by Mt. Gox continues to tremble the cryptocurrency community. The platform continues to have a big impact on the market.
Nevertheless, these repayments have not yet been followed by any significant sell-offs. Instead of panicking, creditors, many of whom are seasoned “hodlers,” seem to adopt a cautious stance. There has been some respite since the payback deadline was extended to October 2024, as stated at the end of 2023. However, the market is driven by instinct and fear, and Mt. Gox keeps creating doubt. After all, fear tends to compound itself.
A few bitcoins were sent to a hot wallet, which is frequently utilized for instant access to money and may indicate a sale in the future. The majority of the bitcoins, nonetheless, wound up in a “new wallet,” most likely as a stopgap measure before being dispersed further. Instead of taking an aggressive stance, this looks to be a cautious one. Nevertheless, the market has a tendency to overreact, viewing every transaction as a red flag and every unknown wallet as a possible danger.
Therefore, it is unclear if this was the cause of the cryptocurrency market selloff. Even if I think this has some influence, the continuous pressure on Bitcoin prices is more a reflection of market anxiety than of a Mt. Gox scenario.
It is evident from examining the market’s response to earlier Mt. Gox moves that the moves had little lasting effect on cryptocurrency pricing. This time around, a distinct dynamic is suggested by the current collapse and the absence of a lasting comeback.
Glassnode: The On-Chain Week
Over time, money moves between various investor groups as the price of bitcoin swings between phases of buying (accumulation) and selling (distribution). These changes are measured by the Accumulation Trend Score, where a score close to 1 (dark purple) indicates heavy buying activity and a score close to 0 (yellow) indicates selling activity.
The graph indicates that weaker market fluctuations frequently occur following periods of intense accumulation, which are followed by selling phases. January 2025 marked the beginning of the most current selling trend, coinciding with Bitcoin’s decline from $108,000 to $93,000.
The Accumulation Trend Score is currently below 0.1, indicating persistently high selling pressure.
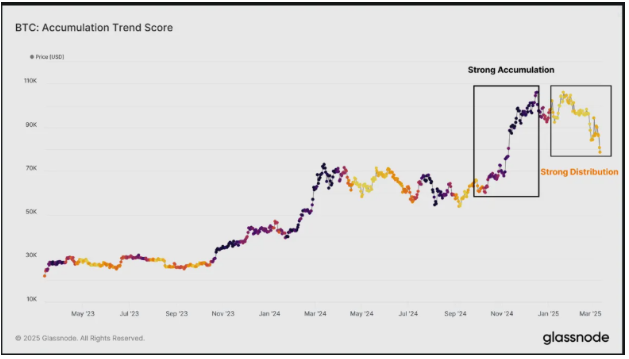
The Accumulation Trend Score monitors the evolution of the total Bitcoin balances on the blockchain. It does not, however, reveal the location of the Bitcoin purchase and is more impacted by the activities of major players. It’s helpful for identifying broad purchasing or selling patterns, but it doesn’t offer comprehensive details about the major price points at which Bitcoin was purchased.
Short-Term Holders’ (STH) cost-basis demonstrates that market momentum has shifted to the downside, with investor anxiety rising and demand declining.
Since the STH-SOPR, a metric that indicates profit or loss for short-term sellers, remains below 1, indicating that the majority are selling at a loss, there are obvious indications of fear-driven selling. STH-CDD, a gauge of recent-holder activity, has increased concurrently, indicating a rise in short-term investor selling.
The market trading close to its bottom range coincides with this selling wave. It’s possible that many recent purchasers are under a lot of financial strain right now.
At this time, none of the aforementioned factors encourage confidence in a long-term bullish rise. The absence of dip-buying this time around is the most important lesson and something we are observing in the US equity markets. Not surprisingly, given the impending global tariffs being proposed by the Trump administration, markets are currently in a phase of capital preservation and risk aversion with no end in sight.
The road ahead appears to be rough, so buckle up and enjoy the trip
Technical Evaluation of Bitcoin/USD
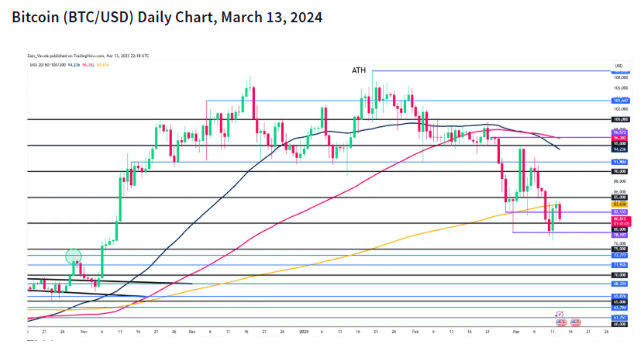
Technically speaking, Bitcoin (BTC/USD) is still in a bearish trend on the daily period.
A shift in structure will require a daily candle close above the 90000 handle, which is still a ways off at the moment.
Yesterday’s attempted rally to the upside was also halted by the 200-day MA, which acted as a major source of resistance today.
The 80000 mark provided support for the drop today, and a small dip below it was greeted by modest buying pressure. The daily candle, however, ended as a bearish engulfing candle, suggesting more down to come.
We have support at the 78197 handle before the 75000 handle becomes clear when we consider the possibility of a break to the downside. The swing high from October 2024 at 73777 might be a crucial region to watch below the 75000 mark.
The 200-day MA at 83636 and 82133 could be resistance points for a move higher from the current pricing. The 85000 handle and the 90000 handle, respectively, will then come into focus
FAQ
The price of Bitcoin is declining due to multiple factors, including Trump’s trade policies, growing recession fears, and Mt. Gox Bitcoin transfers, all of which have increased market uncertainty.
Mt. Gox-related transactions create fear and uncertainty in the market. While no major sell-off has followed recent transfers, investors remain cautious, leading to volatility and price drops
Bitcoin remains in a bearish trend, with strong resistance at $90,000 and support around $78,197 and $75,000. Technical analysis suggests further downside pressure unless a significant breakout occurs
The Accumulation Trend Score indicates whether investors are buying or selling. A score below 0.1 suggests high selling pressure, which aligns with Bitcoin’s recent price decline.
Yes, concerns about a global recession, driven by Trump’s economic policies and tariff plans, have led to risk-averse behavior in the market, causing Bitcoin prices to drop


 Bitcoin
  Ethereum
  Tether
  XRP
XRP  BNB
BNB  Solana
  USDC
USDC  Dogecoin
  Cardano
  Avalanche
  Shiba Inu
  Toncoin
  Pepe
Pepe